Commence With Gratitude to The Most Benevolent, The Ultimate Knower, for Knowledge.
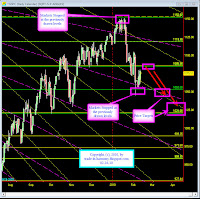
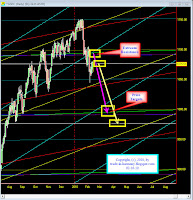
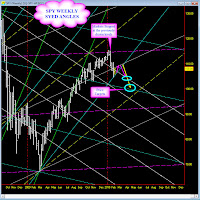
Financial Markets found a natural support on Feb, 5th at the previously predicted levels. Then the markets exhibited a price pattern, foretelling another leg down. I believe that we may have one or 2 days sideways or at the most slightly up move to the levels indicated on the charts (click on the charts to enlarge).
Some Forecasts from the Past:
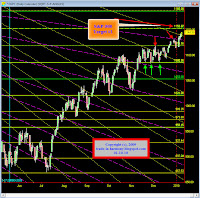
I was reviewing at my old forecasts and charts, it revealed that Financial Markets stopped just withing one 3/4 point of my predicted high price of S&P-500 (please see the forecasts of 12-07, where I predicted future time cycles coming, we did have CITs on these exact dates and then forecast of 01-11, to watch for S&P future price, to offer resistance and start of down move).
THE MOST ACCURATE FORECASTING OF FINANCIAL MARKETS
http://trade-in-harmony.blogspot.com/


The selfless M Syed, you are a light in the darkness for all of us.
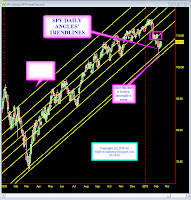
Thanks so much for your updates Mr Syed, appreciate it greatly. Could I ask please: in your first chart, you show a resistance level of 1085.86 on the SPX, and in your weekly SPX chart at the bottom, the resistance you draw in the upper box looks like it corresponds to 1100 (or perhaps I am not seeing right!). Can I assume then that you would be shorting if we hit 1085 on the SPX today shortly after the market open? Thanks so much!
Cheryl
Thank you for encouraging and kind comments.
Yes, the resistance is 1085 area, (up to 1098, based upon weekly). I shall be watching hourly chart with volume, to enter the short.
Thanks for leaving your comments with your names.