Another lesson in chart pattern:
The head and shoulders pattern is usually considered as a reversal pattern and it is frequently seen in uptrend. It is also most dependable when found in an uptrend as well. The market begins to slow down and the supply and demand are generally regarded in balance. Sellers come in at the (left shoulder) highs and the downside is prodded (starting a neckline.) Buyers shortly return to the market and push through to new highs (and thus forming a head.) Nevertheless, after the new highs, the downside price is probed again (and thus continuing neckline.) Cautious buying re-surfaces and the market rallies once more, but fails to take out the prior high. (This lower swing high is regarded as the right shoulder.) Buyers give up and the market tests the downside again. The trend-line for this pattern should be drawn from the beginning neckline to the continuing neckline. Volume has a great importance in the head and shoulders pattern than other patterns. Volume usually increases as the price moves higher on the left shoulder. Though, the head is formed on reduced volume indicating the buyers are not as forceful as they were earlier in the uptrend. The last rallying attempts to form the left shoulder on even lighter volume, indicating that the buying has been exhausted. Then, new selling ensues. The pattern is complete when the market breaks the neckline. Volume should increase on the breakout of the trend-line.
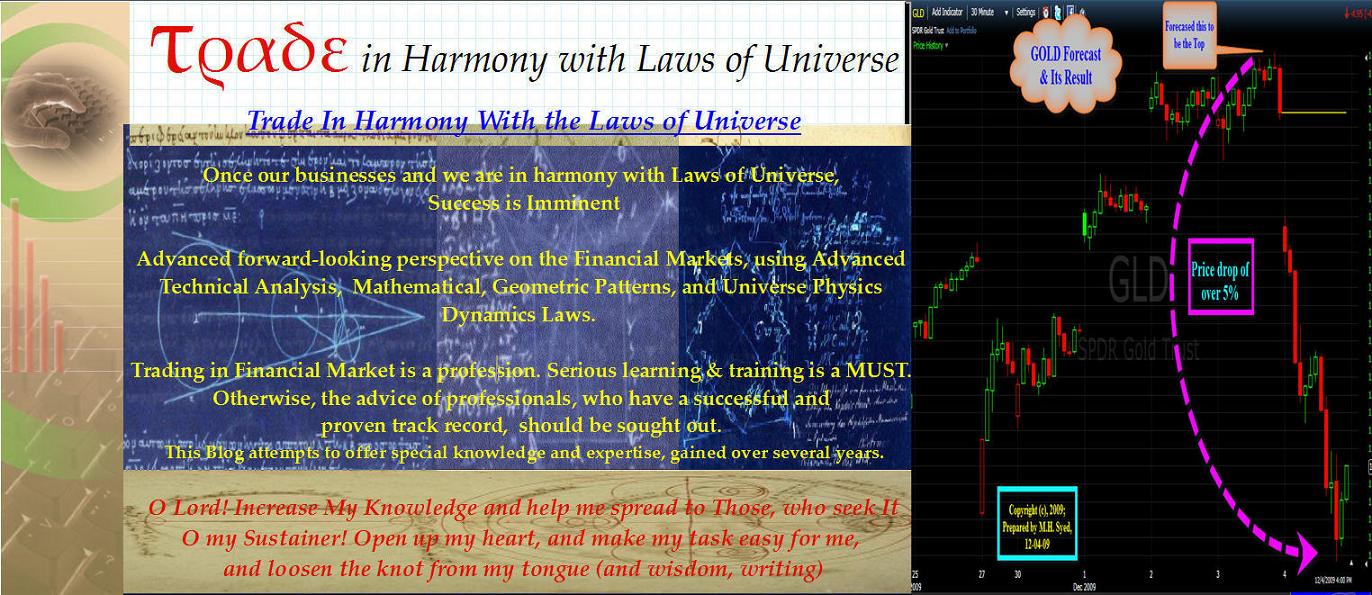
 SPDR Gold Trust, symbol GLD, has been following my price and time squaring angles trend-lines and NHN numbers trend-lines religiously. As stated in previous post, that these trend-lines, also, form a bearish “Flag or Pennant chart pattern“: Furthermore, it is potentially developing a head and shoulder pattern. The later part of head & shoulder pattern also contains a smaller “Symmetrical Triangle Pattern”.
Based upon all of the above, I believe that Gold Commodity shall decline tomorrow.
Thank You The Almighty, The All Knower! for all knowledge!
THE MOST ACCURATE FORECASTING OF FINANCIAL MARKETS
http://trade-in-harmony.blogspot.com/

We need to see 110.50 break followed by 110. Like to see that Jan 4 gap filled!!