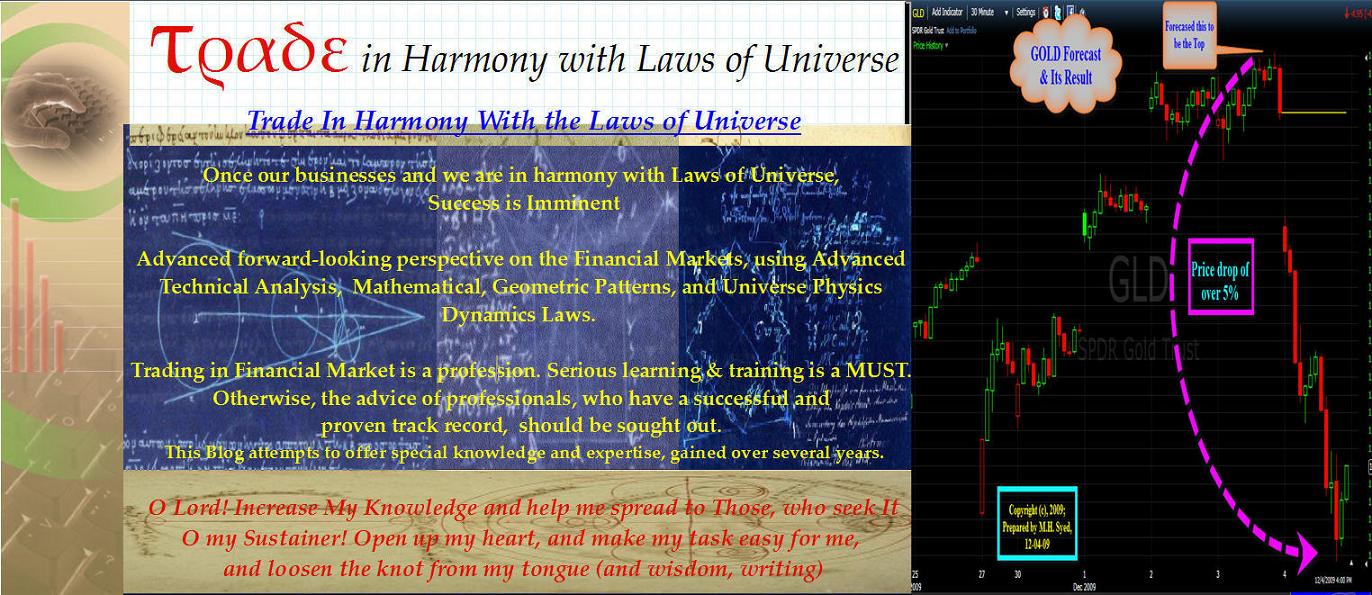
As you can see the GLD closed just exactly on the squaring angles line previously drawn on the chart since Dec 02, 2009. Does that mean that we have intermediate support, quite possibly.
We may consolidate and then head lower. We closed our shorts on Friday. We can enter short again, based upon the price action and previously I had stated the further down target. Click on the charts to enlarge.
GLD Wkly Chart Squaring Time & Price
 I am adding another chart with one more mathematical and geometrical perspective of GLD. It is GLD chart with arcs. Arc is a very powerful predictive tool. It can be used very handsomely to pinpoint price and time turns in a market trend, if chart is scaled properly. Arcs, reveal more information than several other time and price cycle tools. Horizontal and vertical lines can be drawn from the edges of the arcs to get the price level support and resistance. Vertical lines drawn, where arc ends, usually results in a drastic price move. See here.
THE MOST ACCURATE FORECASTING OF FINANCIAL MARKETS
http://trade-in-harmony.blogspot.com/


