Thank you for sending me your warm and kind well-wishes for my recovery. My fever has been hauntig me every night. Last two nights, I had to rest in to make sure that my body shall have stored energy for the coming week.
Now let’s discuss business!
Stock Markets are trying to find some directions. Since 08-07, SP-500 has been moving in a particular mathematical inter-related pattern. My following market analysis and market forecast is based upon squaring analysis of recent SP-500 high, March 6th low, and other patterns developed since August 7th high and August 17 low.
Mathematical patterns rule all the financial markets, stock markets, or commodity markets.
 The specific mathematical pattern started from 08-07-09, and squaring from the Dec 4th high and March 6th low, also coincide in time and price. Based upon, said analysis, I anticipate that stock market ought to be heading down at least 84 points from the Dec 4th high. Therefore, I have a down target of at least 1,035 for SP-500. There is strong support at 1080 level. I am expecting that to be violated with gap down or long down bar.

3rd chart, shows that SP-500 stopped exactly at the 7/8th of the wave extension of the 03/06 low to June high. If a market is moving higher and has gone as high as 7/8th level, it has the best odds potential to reverse, based upon MM rules. This 7/8th wave extension also exactly coincided in price 50% retracement from the 2007 high.
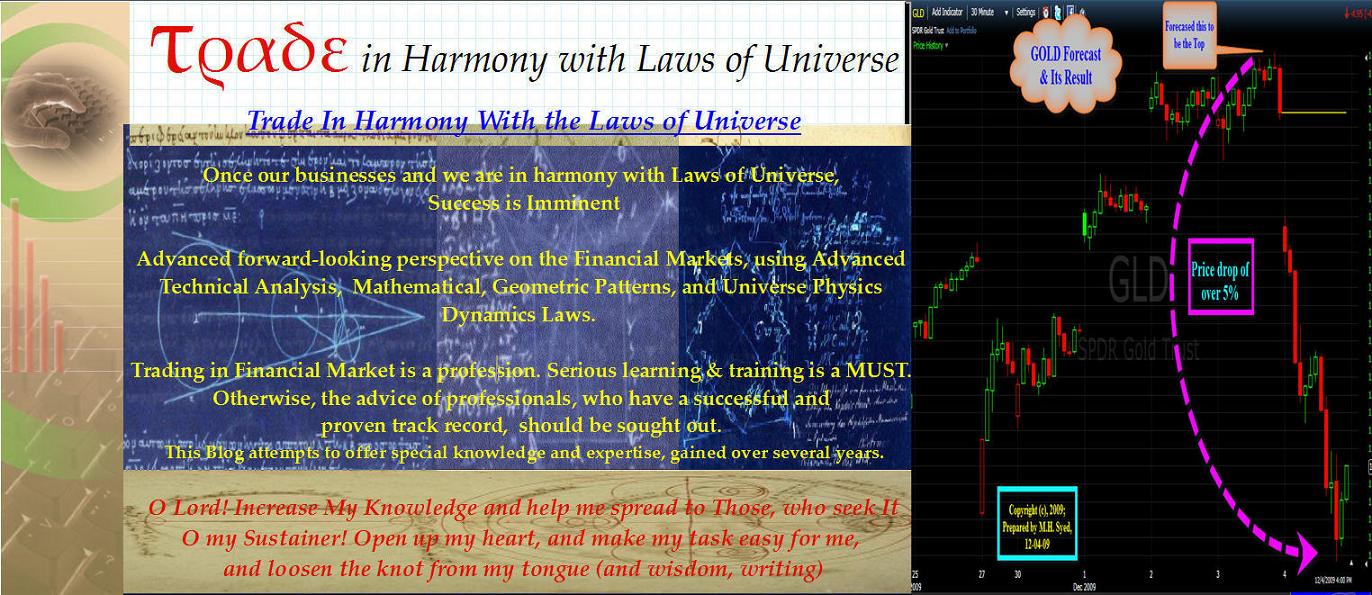
Although, I am strongly leaning towards bearish move of the stock markets (and gold commodity market). But the end of month and end of year, cylce, sometimes, can trip all the analysis over.
SP-500 Hourly Chart Head and Shoulder Pattern Developing?
THE MOST ACCURATE FORECASTING OF FINANCIAL MARKETS
http://trade-in-harmony.blogspot.com/


